CMX Network Reports
This topic describes how to use Replicated Compatibility Matrix (CMX) network reporting to collect and analyze network events from VMs and clusters, helping you understand your application's network behavior in different environments including air-gapped scenarios.
For information about changing the network policy of a VM or cluster to simulate air-gapped environments, see Test in Air Gap Environments.
Overview
CMX network reporting helps you understand your application's network activity by capturing and analyzing network events from VMs and VM-based clusters. You can use network reporting to:
- Monitor network activity in real-time or review aggregated summaries
- Identify unexpected network calls before deploying to production
- Validate application behavior in air-gapped environments
- Troubleshoot connectivity issues
To provide flexibility in testing, you can enable network reporting to capture all network activity, whether the network policy is set to open or airgap. Even when the network policy is set to airgap and network egress is blocked, all connection attempts and DNS queries are still captured in the report.
Collect and View Network Reports
Network reporting is not enabled by default. For information about how to collect and view reports through the Vendor Portal or the Replicated CLI, see the sections below.
There are two types of network reports:
| Report Type | Contents |
|---|---|
| Running Report See all network events captured in near real-time |
|
| Report Summary Aggregated analysis of captured network events |
|
Vendor Portal
To set the network policy and collect and view reports in the Vendor Portal:
-
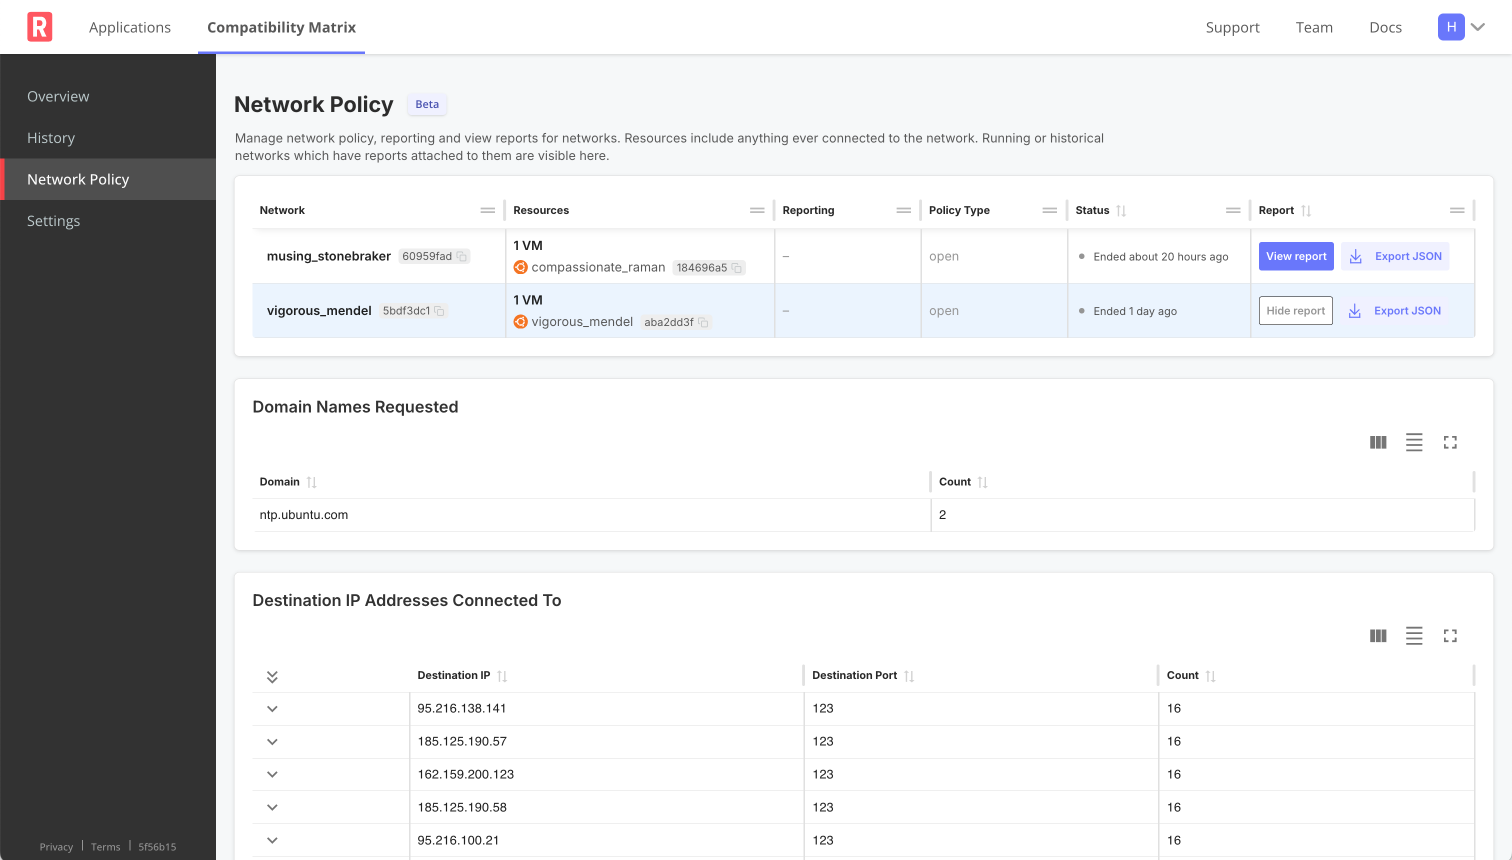
Go to Compatibility Matrix > Network Policy.
-
To collect a network report, toggle on the switch under Reporting.
-
(Optional) Toggle from
opentoairgapunder Policy Type to block all network egress. -
Where available, click "View report" under Report to see the reporting table. You can also click "Export JSON" to download the raw report data.
noteWhen reporting is ON for an active network, all network events display in a Running Report. Once the network is terminated, the Report Summary is automatically generated.
Running Report
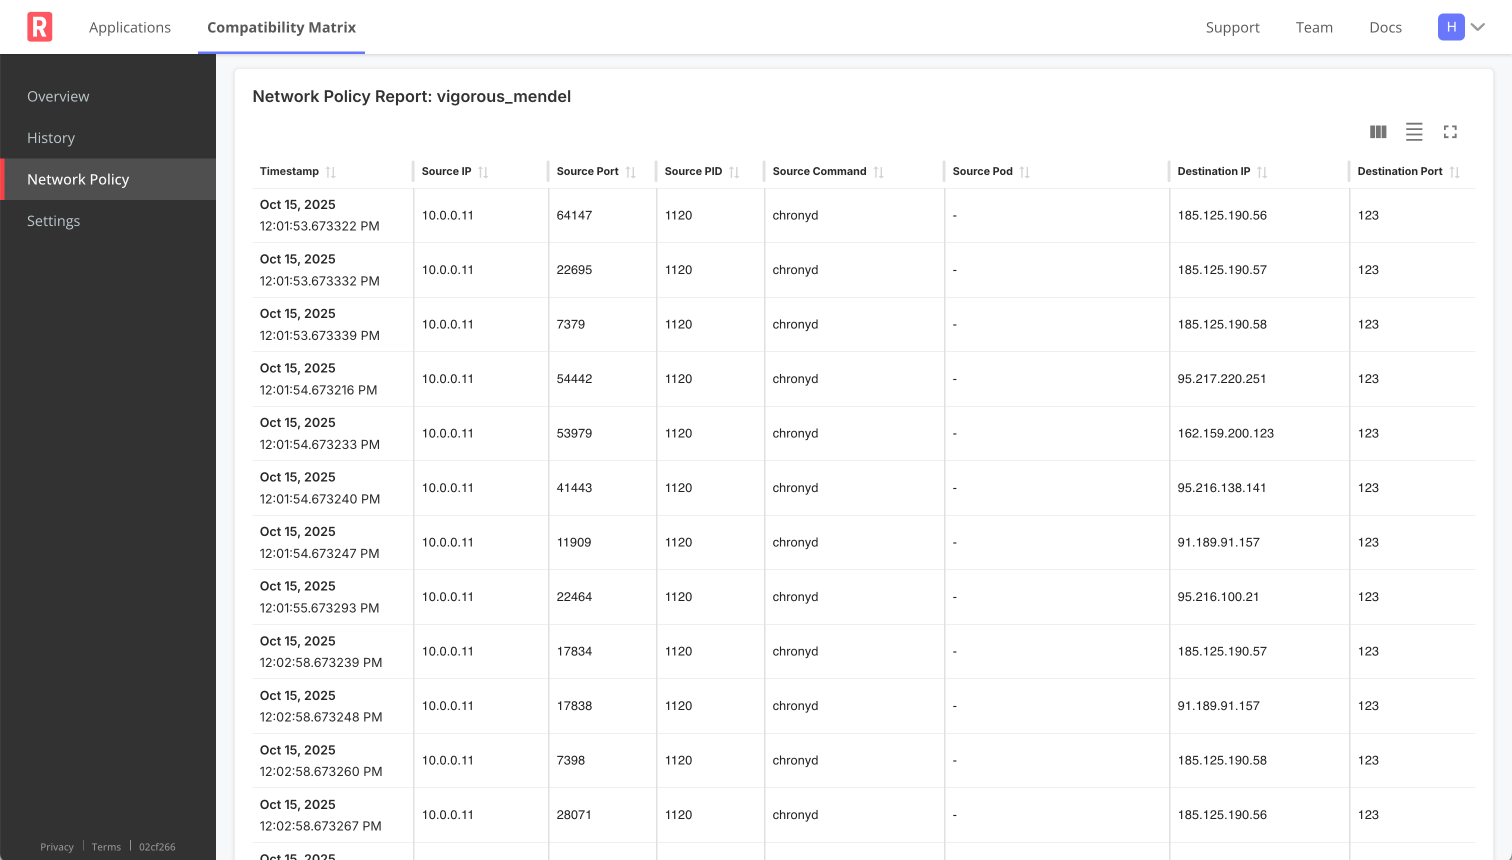
View a larger version of this image
Report Summary
CLI
To collect and view a network report from the CLI:
-
Turn on network reporting:
replicated network update NETWORK_ID --collect-reportWhere
NETWORK_IDis the ID of the network. You can get the network ID by runningreplicated network ls. -
(Optional) Confirm that reporting is ON for the network:
replicated network lsExample output:
ID          NAME                   STATUS          CREATED                    EXPIRES                    POLICY        HAS REPORT
a1b2c3d4    example_network_1      running         2025-01-28 16:04 PST       2025-01-28 18:06 PST       open          off
e5f6g7h8 example_network_2 running 2025-01-28 12:10 PST 2025-01-28 20:11 PST airgap on -
View the network report:
See network event summary that aggregates all unique domains and destination IPs, with connection counts and other details (JSON format):
replicated network report NETWORK_ID --summarySee all network events (JSON format):
replicated network report NETWORK_IDWatch as new network events occur (JSON format):
replicated network report NETWORK_ID --watchnoteNetwork events are batched for display in the report, so appear with a short delay.